Underwrite before you commit
The figures in this post are checked against Dubai Land Department records and RERA filings. Get an independent underwriting score on any project, or ask Javier on WhatsApp.
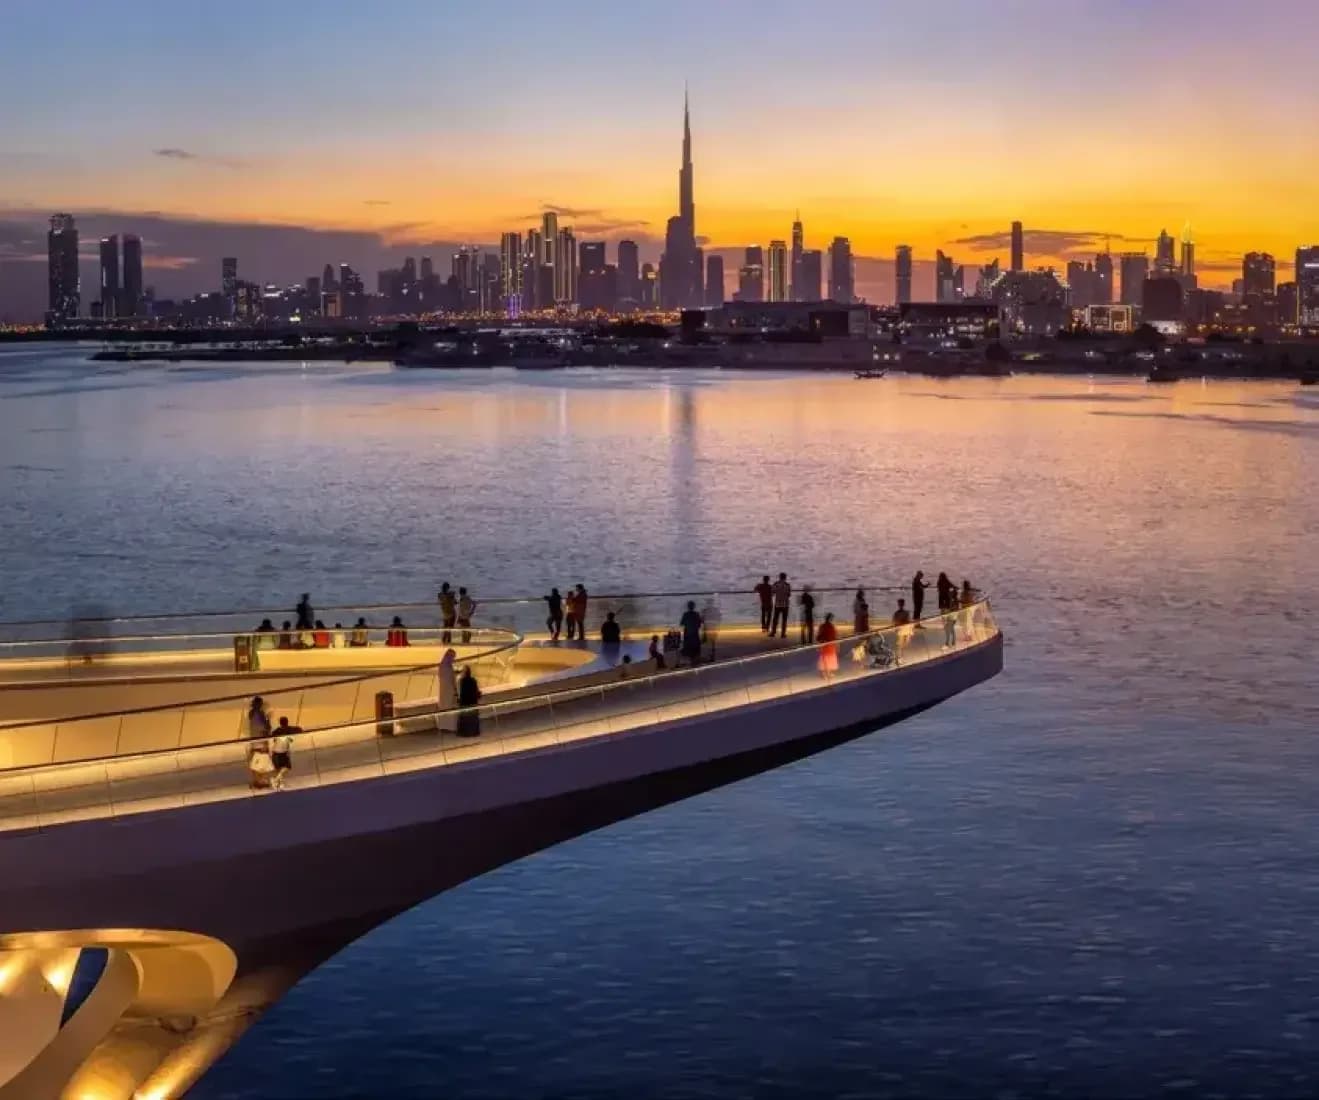
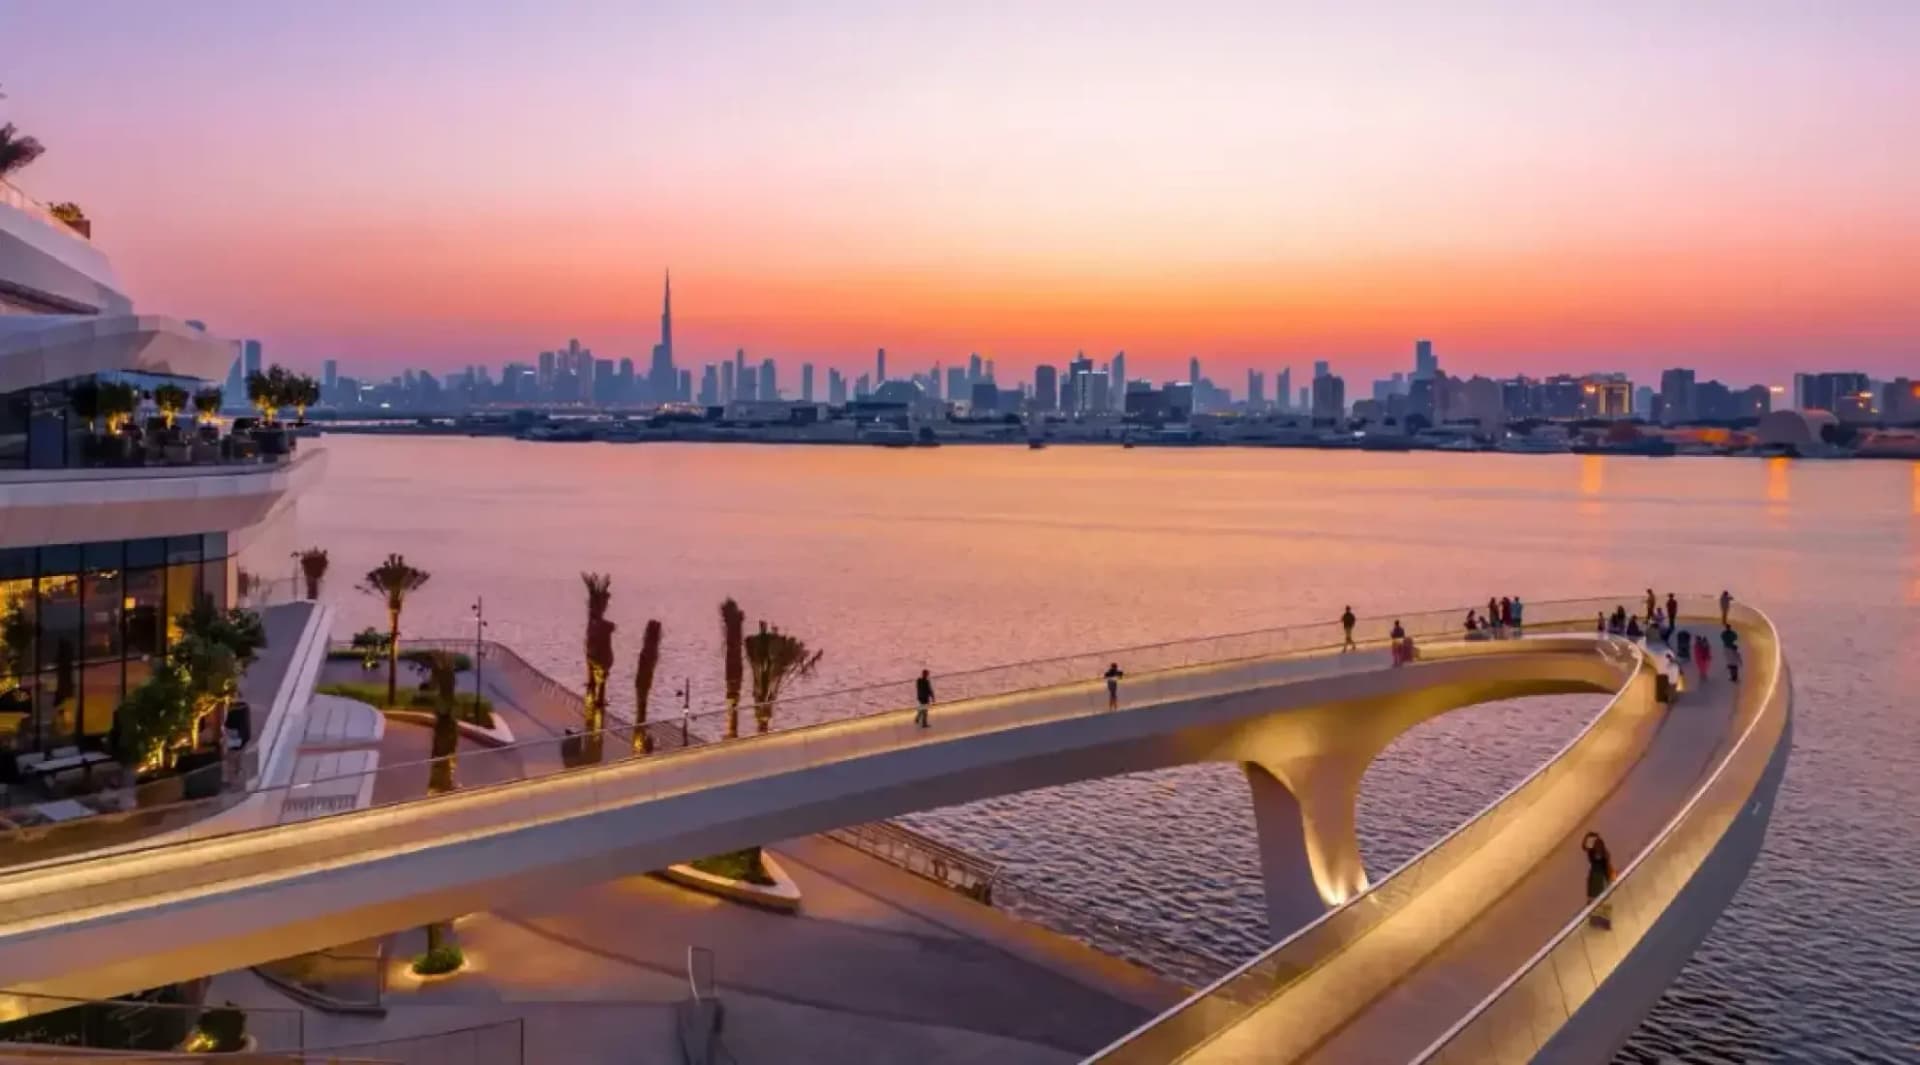
Two Emaar Master Plans, Different Investor Profiles
Dubai Creek Harbour and Downtown Dubai are both Emaar's flagship master plans, both deliver consistent build quality, and both anchor tenant demand for the high-income white-collar segment. The differences lie in pricing, master plan maturity, and yield-versus-growth profile.
Pricing Comparison
Downtown one-beds (Burj Royale, Forte, BLVD Heights) trade at AED 2,800 to 3,800 per square foot. Creek Beach and Harbour Views one-beds at AED 2,000 to 2,200 per square foot. Creek Harbour is 25 to 35% cheaper for similar Emaar build quality and waterfront positioning.
Two-beds: Downtown AED 2.6 to 4.5M for 1,150 to 1,400 sqft units. Creek Beach AED 2.6 to 3.4M for similar size. Discount holds at 20 to 30%.
Branded residences
: Downtown Address and Armani trade at AED 4,500 to 8,000 per sqft. Creek Harbour Address Residences at AED 3,200 to 4,200. Discount widens to 30 to 45%.
Yield Comparison
Downtown one-beds yield 4.5 to 5.5% gross because of high absolute pricing. Creek Harbour one-beds yield 5.5 to 6.5% gross. Creek Harbour wins by around 1.0 percentage point.
Two-beds: Downtown 4.0 to 5.0%, Creek Harbour 5.0 to 6.0%. Creek Harbour wins by 1.0 percentage point.
Net yields: Downtown 3.0 to 4.0% post all costs, Creek Harbour 4.0 to 5.0%. Creek Harbour delivers materially better cash flow.
Capital Growth Comparison
Downtown has shown 6 to 9% annual capital growth since 2022 (mature market, scarcity-driven). Creek Harbour has shown 9 to 14% (master plan maturation, district completions). Going forward 2026 to 2028, Downtown is likely to slow to 4 to 7% as scarcity normalises and Creek Harbour to slow to 7 to 10% as master plan matures.
Long-term (10 year), Downtown is the safer compounder because of Burj Khalifa scarcity and global brand recognition. Creek Harbour has higher 5-year growth potential but less proven 10-year compounding history.
Tenant Demand and Vacancy
Downtown vacancy runs 4 to 7% with strong demand from finance professionals, expatriate executives, and short-term-rental operators. Average tenant stay is 18 to 24 months.
Creek Harbour vacancy runs 6 to 9% with demand from Emirates and Dubai-based corporate executives plus a smaller short-term-rental segment. Average tenant stay is 15 to 20 months. Slightly weaker demand profile but improving as master plan matures.
Which to Choose
Choose Downtown if your priority is brand prestige, global recognition, immediate liquidity on resale, and you accept yield in the 3.0 to 4.0% net range.
Choose Creek Harbour if your priority is yield-plus-growth balance, Emaar pedigree at 25 to 35% lower entry, and you accept master plan still maturing.
Diversify if budget allows AED 5M+: one Downtown one-bed for prestige and liquidity, one Creek Beach two-bed for yield and master plan upside. The two clusters complement rather than overlap.
Frequently Asked Questions
Is Creek Harbour better than Downtown for yield?
Yes. Creek Harbour delivers 1.0 percentage point higher gross yields (5.5 to 6.5% versus 4.5 to 5.5% in Downtown on one-beds) because pricing is 25 to 35% lower while rents are only 10 to 15% lower.
Is Downtown better for capital growth?
Long-term yes (10 years+) because of Burj Khalifa scarcity and global brand. Short-term (3 to 5 years) Creek Harbour has shown stronger growth (9 to 14% annually versus 6 to 9% in Downtown) as the master plan matures.
Which has stronger short-term rental potential?
Downtown by a clear margin. Average daily rates AED 600 to 1,200 with 75 to 85% occupancy. Creek Harbour AED 350 to 600 with 60 to 75% occupancy. The fountain show, Dubai Mall, and metro proximity give Downtown a structural advantage for tourist demand.
Are service charges different?
Downtown runs AED 22 to 35 per sqft (Burj Khalifa Boulevard towers can reach 40+). Creek Harbour runs AED 16 to 24. Net yield gap widens further once service charges are deducted.
Can I diversify across both?
Yes for portfolios above AED 5M. A common allocation is one Downtown one-bed (AED 2.5 to 3.5M) for prestige plus one Creek Beach two-bed (AED 2.6 to 3.4M) for yield. The two compound on different drivers (scarcity versus maturation), reducing portfolio correlation.
Explore further
The project, area, and developer this post covers, with live Dubai Land Department data.
Related articles

Dubai Creek Harbour Districts and Investor Guide 2026: Yields, Districts, and Emaar's Pipeline

Dubai Creek Harbour Yields and Pricing 2026: District Breakdown

Best Dubai Creek Harbour Towers in 2026: Tower Track Record Analysis

Creek Harbour vs Downtown: Price Comparison

Tilal Al Ghaf Investor Guide
Al Furjan Investor Guide
Related Dubai property analysis from the Oliva editorial team.